2020-01-31
Fast cloth color identification from customer images
Original article here on the leboncoin tech blog
Introduction
During the summer of 2019, I had the chance to work for the french company "Leboncoin", which is the french equivalent of CraigsList. It provides a market place for everyone to exchange their goods with no middleman.
I was hired to work on the search engine and to improve it using novel strategies.
Leboncoin had recently introduced more filters in the clothing category, notably the "color" filter. However, not everyone that posts an ad fills that field, and in half of them, the color wasn’t even in the description.
This article explains the color detection algorithm I developed to automatically tag thoses ads. The projected lasted 2 weeks, and achieves an 82% success rate.
. . .
The goal was to detect the primary color of an ad by extracting it from the images. This is a known problem, but they were not any solution out of the box that met the following criteria:
- Fast — a few milliseconds — since it was going to be applied to ~2 million ads, and it makes it easier to deploy.
- Easily translatable to Go, since this is the core language at leboncoin and it had to be integrated into the submission process.
- Accurate, since consumers expect good results when they use a filter on leboncoin.
All available solutions either took a few seconds to run or heavily relied on big scientific libraries like scikit-learn which is far too heavy for this task. A homemade algorithm had to be created.
Choosing the colors
Colors were determined from the filter, by merging certain colors (like “cream” and “white”) and not trying to tag non-colors like “multi-color” or “prints”.
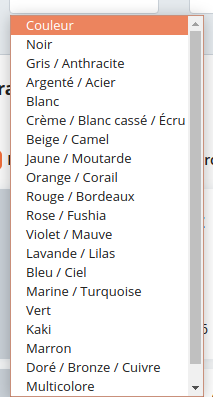
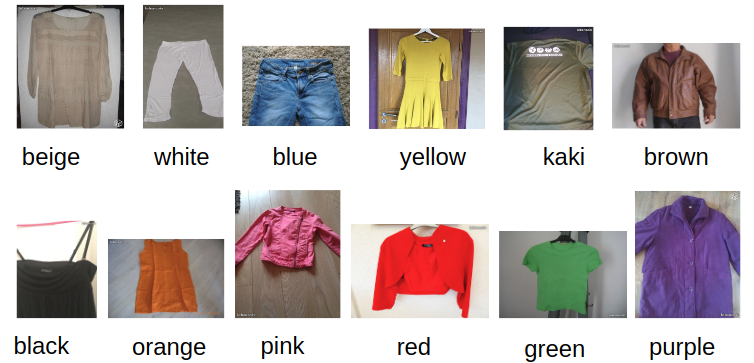
In the end, the list is composed of 12 distinct classes of colors.
Gray isn’t a part of the list, because customers don’t agree at all on what is gray, making it impossible to check if a model is performing well or not. (Adding gray to the list resulted in a ~95% error rate and added confusion to the other classes)
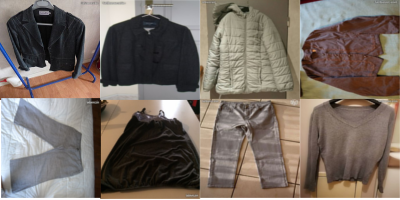
All theses cloths were classified as gray.
Getting the data
To train and evaluate our model, examples were needed from all classes in a balanced way. Luckily leboncoin has a very big dataset of ~3 million ads in the clothing category with images associated, about half of which has a color in the description.
First, 1000 ads of each class were queried where the color appeared uniquely in the title. It can be done directly from the website with a query of the form “green NOT red NOT blue NOT yellow…”, but it was easier to plug directly into Elasticsearch and download the image references.
Then, all the images were downloaded (about 600 Mo) and split in training/test datasets with 90% going for training. No validation dataset was made as the model is not really prone to overfitting because of its simplicity.
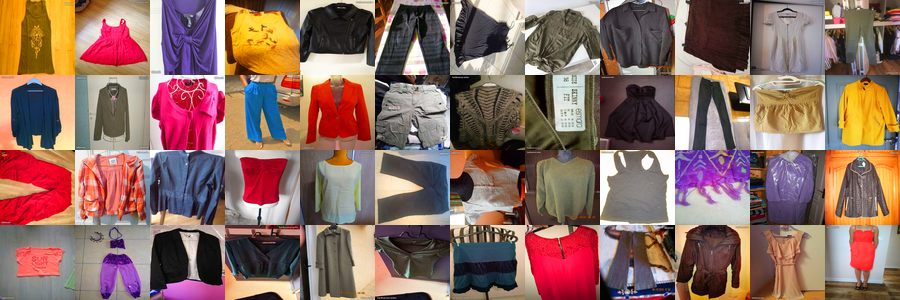
40 random samples from the dataset
The model
Preprocessing
Preprocessing is done in 3 steps.
- Resizing the image to 256x256px.
- Cropping the image, by cutting a quarter of each side.
- Augmenting saturation.
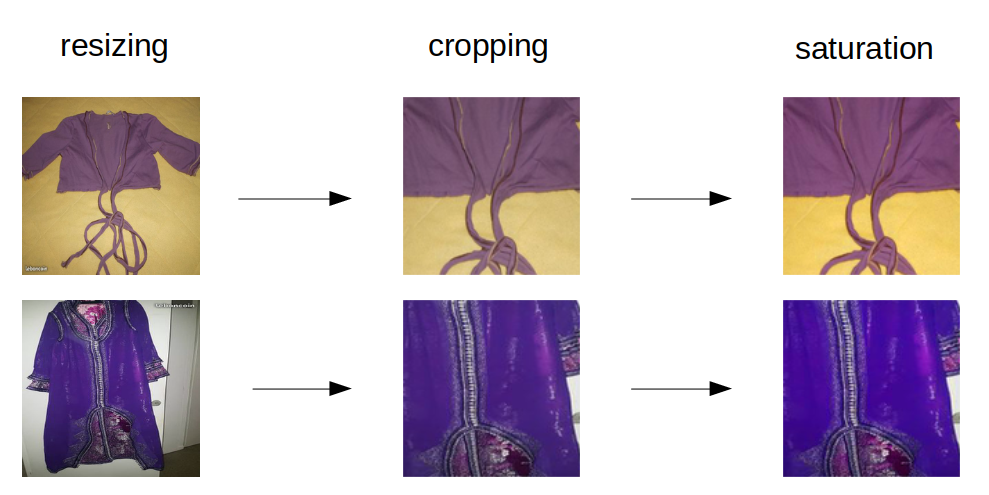
As the cloth is most often in the middle of the image, cropping helps a lot to separate the background from the object of interest. Augmenting saturation also helps by making colors more vivid.
To do the image processing, the Go library “imaging“ was used which is fast enough and effortless. It does not have any heavy dependency such as opencv or vips.
Extracting the primary color
To extract the primary color of an ad, all the images should be used and their information combined. The assumption is made that all images are of the same object; Albeit this is not always the case, as leboncoin allows packs to be sold as one ad. However, there was no time to handle this correctly.
The first step is to detect in each image the dominant colors. The famous K-Means clustering technique was used, as it is known to converge fast and give good results.
To resume how K-Means works, it starts with k random clusters. At each update, points are attached to their closest cluster. Then the new clusters are the means of the points which are attached to them. This process is iterated until no points change side — convergence.
The clusters here are clusters of pixels, each pixel in the image is treated as a point in (Red, Green, Blue) space.
Here is K-Means run on the 2 images using k=4:
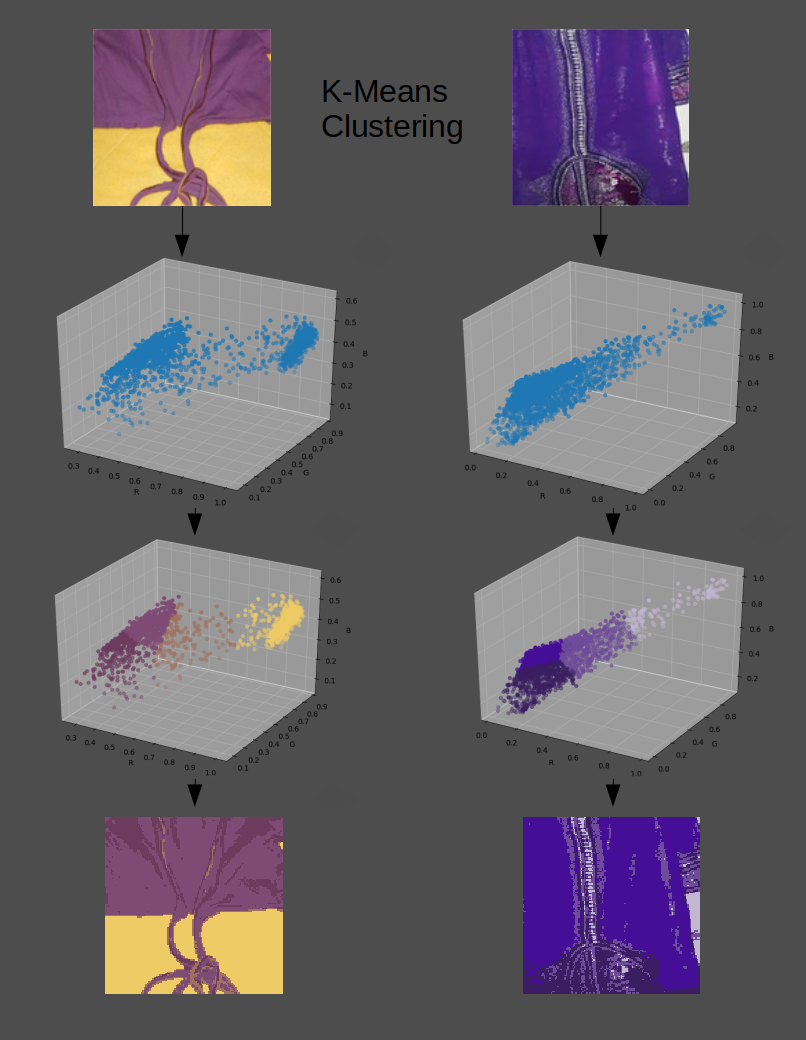
The first figure is the image itself.
The second figure is the pixels plotted in (R, G, B) space.
The third figure is a visualization of which pixel belongs to which cluster after convergence.
The fourth figure is the mapping of pixels to their corresponding cluster.
. . .
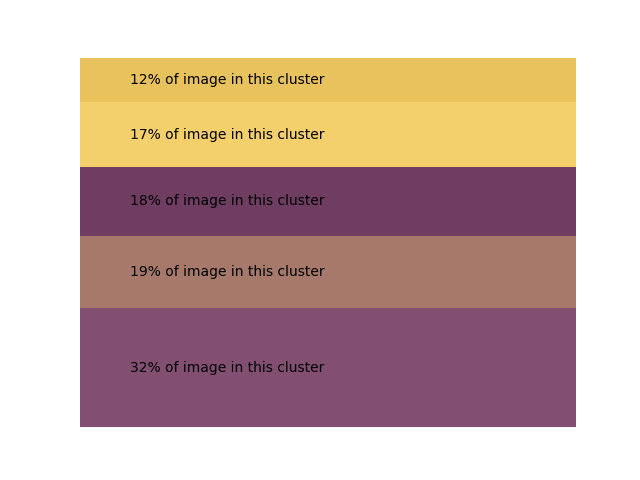
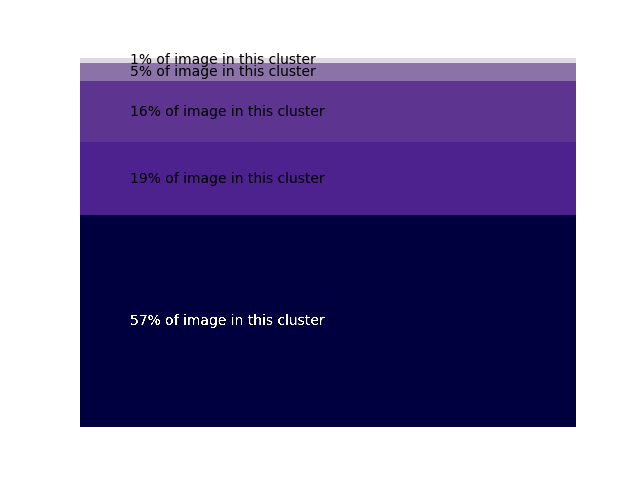
After K-Means is run, a “medium average cluster” is also added to the list of clusters.
It corresponds to the average color of the image, and its size is arbitrarily defined to be ~20% of the original image. It is added because if the clusters are too spread out, then no cluster is better than the other so the average is also a good estimation of a primary color.
But how to assess which cluster is important? A good metric is the number of points belonging to a cluster. Indeed, if a cluster is big, it covers more of the image, therefore, it is more important.
Once these 5 clusters are calculated for each image in the ad, they are aggregated in a single list and put through the following algorithm:
If there is a single image, then return the biggest cluster.
If not, find among the biggest 3 clusters which 2 clusters are closest.
Intuitively, if 2 images in an ad are of a red socket, then red should be the common color between the top 3 clusters (with some background color as the third cluster).
Classifying the projected color
Now that there is a function which projects any ad onto its primary color, there is still no way to convert that color in an actual class/answer.

Is this red or pink? This is quite subjective and depends on your monitor settings.
Here is a visualization of the projection function using all of the training data.
The colors are intertwined, and even if they are a bit separated, some way to extrapolate must be used. This is exactly the task of any machine learning model; A neural network could work, but it makes it harder to iterate and implement, and there are few benefits on such low dimensionality over simpler methods.
Instead, a K-Nearest Neighbors classifier can be used:
First, calculate and memorize the primary color of all the training data (which is labeled). Then, to deduce the class of an unknown color, compare its primary color to the k closest points from the training data and make a vote.
(k=9 was used as it gave the best results.)
For a concrete example, here are the 9 nearest neighbors of the first and the second image that was used before:
In the first image, the answer is simple: All of its neighbors are purple, thus the answer should be “purple”.
However, for the second image, there are 4 “pink”, 3 “brown”, 1 “red” and 1 “white”.
It is tempting to say that the answer should be pink since it has the highest vote. But if the answer was whichever class is most present around a point then there would be some unpredictable results at the border, where a slight change in color would result in the class changing abruptly.
To nuance this, a threshold t is introduced which corresponds to the minimum amount of votes a class needs to be significant. When the number of votes is below the threshold, the answer is “I don’t know”.
This induces a trade-off between the precision — number of images labeled correctly — and the recall — number of images where the answer was different from “I don’t know”.
Here is a graph of the precision and recall as t varies from 3 to 9. (Green square is t=6)
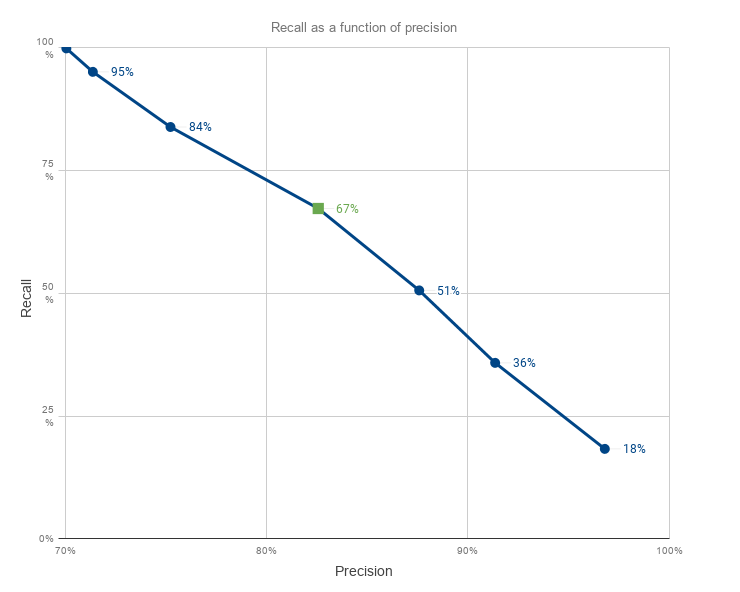
In the end, the value picked was t=6 for a 67% recall and 82% precision. This stems from a common technique that consists of choosing the value at the “elbow” of the curve which in a way maximizes our trade-off.
Integration
Leboncoin recently repaid its technical debt in the submit process, making the integration of this algorithm painless. There were many places where it could have been plugged, like when the user uploads an image, during indexation or when the ad is available on the site.
It was decided that it would be executed asynchronously after an ad is successfully uploaded, in parallel with all other tasks concerning a new ad like moderation, premium options…
On the flip side, only new ads get color detected. But since processing an ad only takes a few milliseconds, it was also run on all past ads — about 3.7 million.
Final note
Customers are for the most part amateur photographers. This can lead to bad white balance, bad lighting, low contrast… Customer cloth color identification is a hard task with a lot of noise, and even if there are still a lot of improvements that could be done, this was a nice little project that was successfully integrated in 2 weeks.